Article Contents
Overview
In the Translation module, articles are plotted in "translational space" on the Triangle of Biomedicine. Papers with high Human scores will appear closer to the Human vertex, while those with high Animal and Molecular/Cellular Biology scores will appear close to those respective vertices.
iCite: Translation uses two triangle visualizations: a bubble plot, and a density plot.
Density plots
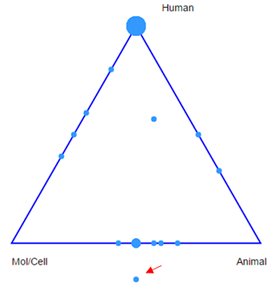
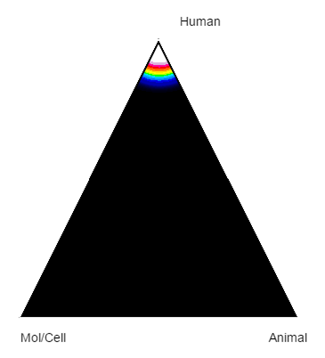
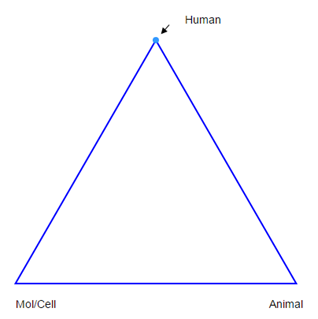
The density plot shows the relative density of articles in an area of the triangle (this is accomplished by treating each coordinate as a point light source, applying a Gaussian blur, and visualizing in pseudocolor where ‘hotter’ colors mean higher article density).The bubble plot shows bubbles located on the triangle where papers are located. Multiple papers can have the same coordinates, so the size of the bubble indicates how many papers are there.
An example of human-oriented research
Frequency and timing of nonconvulsive status epilepticus in comatose post-cardiac arrest subjects treated with hypothermia, Neurocrit Care, 2012
An example of animal-oriented research
Force plate gait analysis in Doberman Pinschers with and without cervical spondylomyelopathy, J. Vet. Intern. Med., 2013


An example of molecular/cellular biology-oriented research
Foxp1 and lhx1 coordinate motor neuron migration with axon trajectory choice by gating Reelin signaling, PLoS Biol., 2010


An example of a mixed portfolio


Animation

The animation bar allows you to visualize the contents of the portfolio over time. Moving the bar will change the years displayed in the visualization. You can manually move the bar, or press “Play” for the visualization to adjust automatically. Click “Export Animation” to export an animated gif.
Interactive bubble plots
The bubble plots provided by iCite: Translation are interactive. If you click on a bubble, only papers in that bubble will appear in the sortable table below the bubble plot:
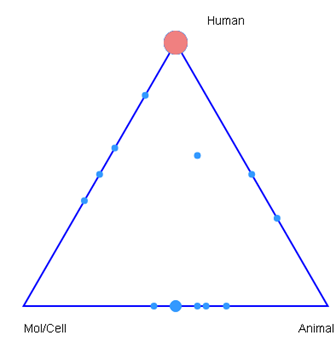
Multiple bubbles can be selected with a click-and-drag gesture with the mouse. Draw a shape around the bubbles of interest. The shape is complete when a dotted line appears between the shape’s starting and ending points as shown below.
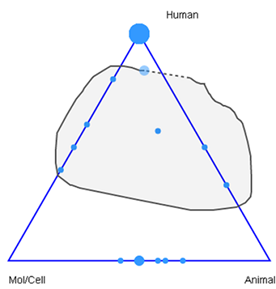
The surrounded bubbles will then be selected.
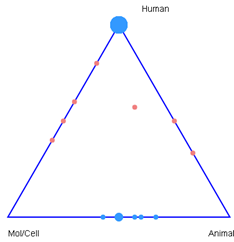
If users draw multiple shapes, bubbles will be added to the selection. To clear, press Esc key on keyboard or click the “Clear filters” button. Article-level data can be downloaded by clicking the “Export” button. Only the selected documents will be included in the download.
Note that if a paper has no MeSH terms that are categorized as Human, Animal, or Molecular/Cellular Biology (e.g. a physical chemistry paper, or a paper that lacks MeSH terms because it is not indexed in MedLine), it will appear below the triangle.